On the Service Menu bar, users can select the option which appears as the first item in the menu to compute SDG 15.3.1 indicator and its sub-indicators forllowing the steps described below:
Land productivity is computed form vegetation indices using three measures of change i.e trajectory, state and performace. Any of the three sub-indicators measures of change as well as the productivity can be combuted as illustrated below
On the indicator menu bar that appears below the area selection panel click on the option. This should pop-up a selection panel as in the diagram below:
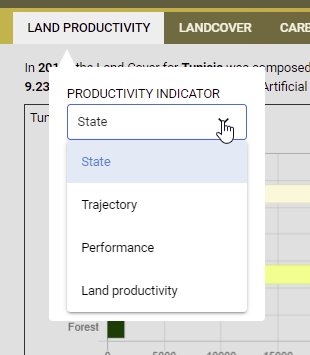
Under the productivity indicator option on the pop-up menu, users can select either of the three land productivity sub-indicators i.e. State, performance, and trajectory or the final aggregated land productivity for their selected area of interest.
Computing land productivity by combining state, trajectory and performance
Complete the selection by selecting the data source and the reporting period.
Note
MISLAND allows users to asses vegetation using high resolution Landsat derived vegetation indices. If the selection of the dataset is landsat the option to specify the vegetation index .i.e NDVI, MSAVI or SAVI will appear under the options.
Once the selection of datasets and reporting period is complete click on the button at the pottom of the selection pop-up window to compute the selected indicator. The map and statistics should be dispalyed as shown below.
MISLAND allows the user to view land cover state for a particular year or to compute landcover changes between two years. The landcover change
can be accessed from the option under the SDG indicator menu as described in the steps below
Select option on the services menu-bar and clic on the option. This should pop up a selection panel as the one shown below
Selecting the Land cover change under SDG 15.3.1 sub-indicators
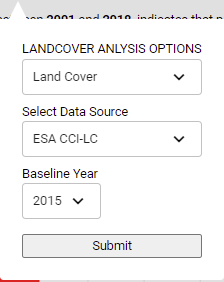
To view the land cover data for a particular year, select ‘Land Cover’ option under the LANDCOVER ANALYSIS OPTIONS folled by a selection of the landcover data source and the year as shown below
Viewing the Land cover data for a particular year
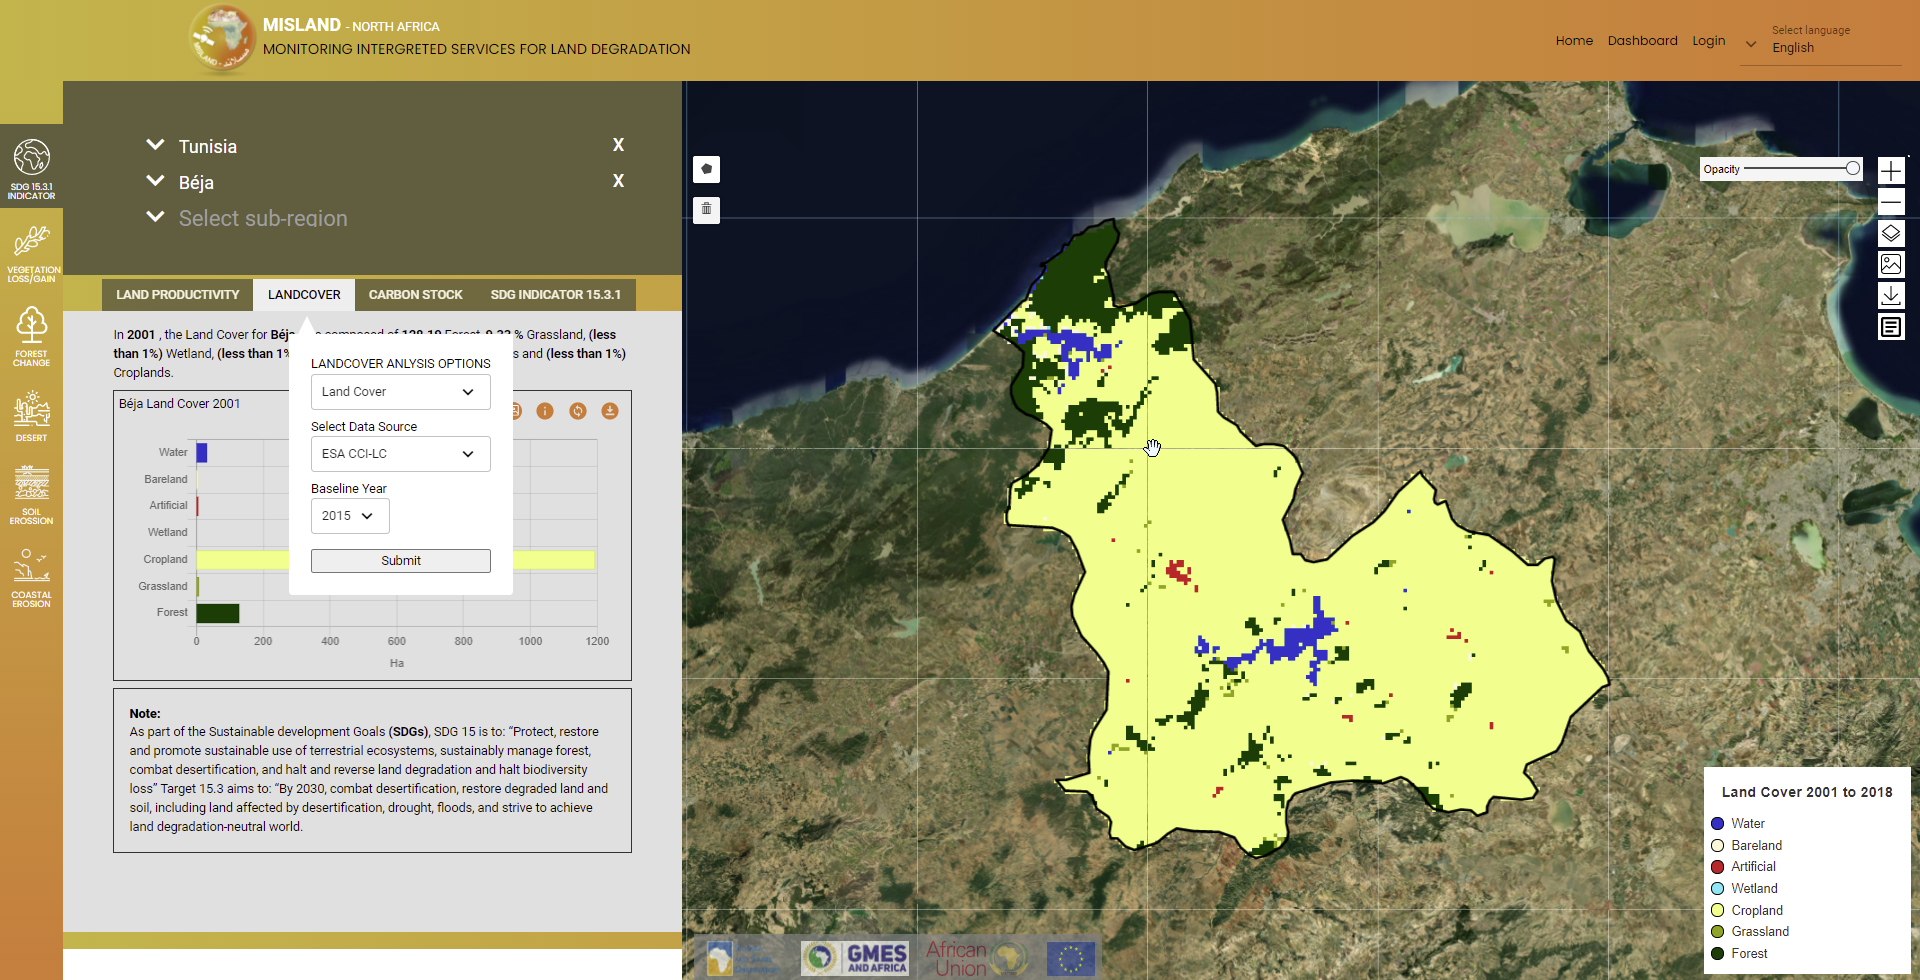
Click on the button and the Land cover map for the chosen year and the summary statistics will be displayed on the map panel and the summary panel as shown below
Viewing the Land cover data for a particular year
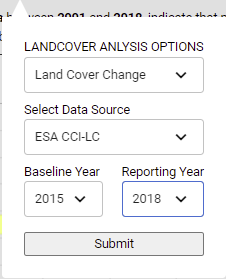
To compute landcover change, selec the ‘Landcover change’ option option under the LANDCOVER ANALYSIS OPTIONS. select the data landcover data source and the baseline and reporting year for comparison as shown
The SDG 15.3.1 Indicator combines the three sub-indicators .i.e changes in land productivity, landcover and carbon stocks discussed previously to asses the land degradation status of the selected area and period. The one-out, all-out (1OAO) approach is used to combine the results from the three sub-indicators, to assess degradation status for each monitoring period at the Indicator level. Within the study region, degradation is considered to have occurred if degradation is reported in any one of the sub-indicators.
To compute the SDG 15.3.1 indicator, follow these simple steps,
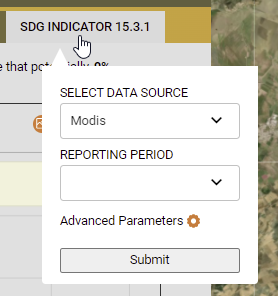
Select the service, on the services menu-bar and click on the option. This should show a pop-up as the one shown below
On the dialog that pops up, select the datasource and the reporting period. and click on the button to get the results
Note
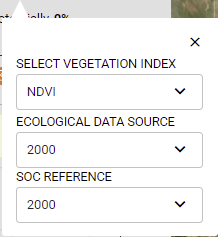
Clicking on the option provides more options to select the vegetation index of choise, the ecological unit dataset and the soil organic carbon reference raster as shown below.
Setting advanced options for the SDG 15.3.1 indicator
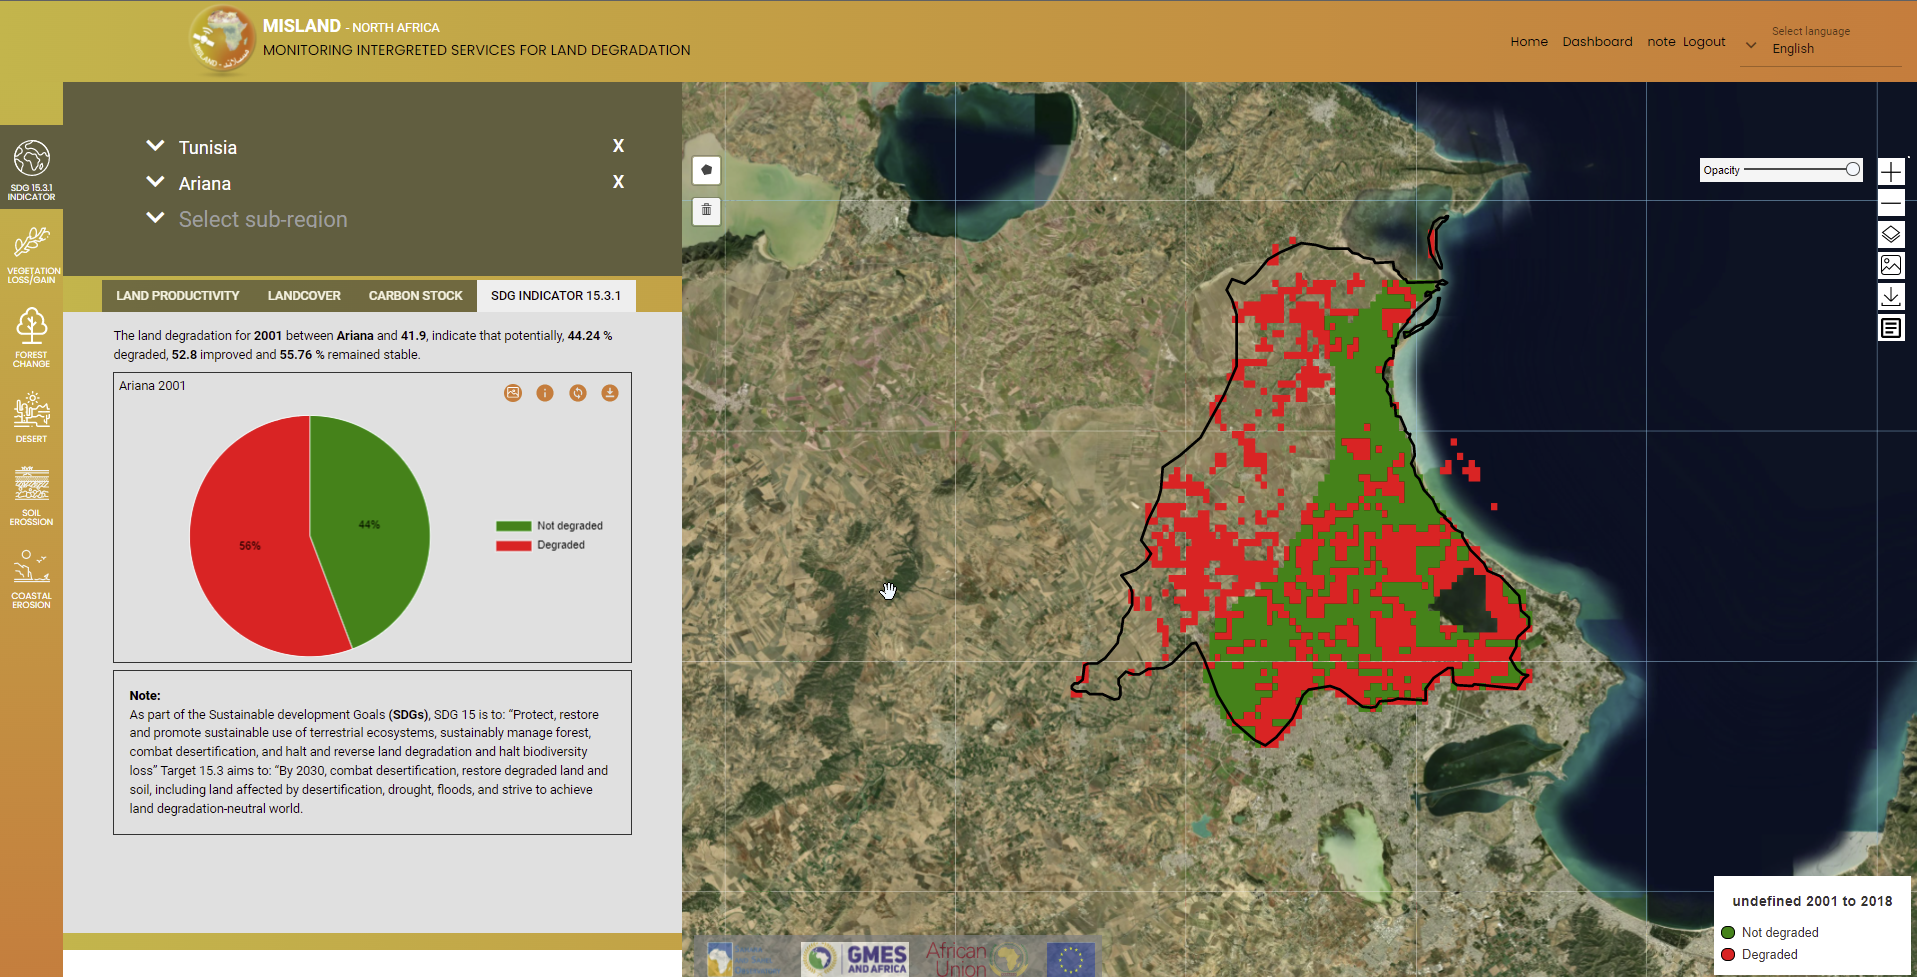
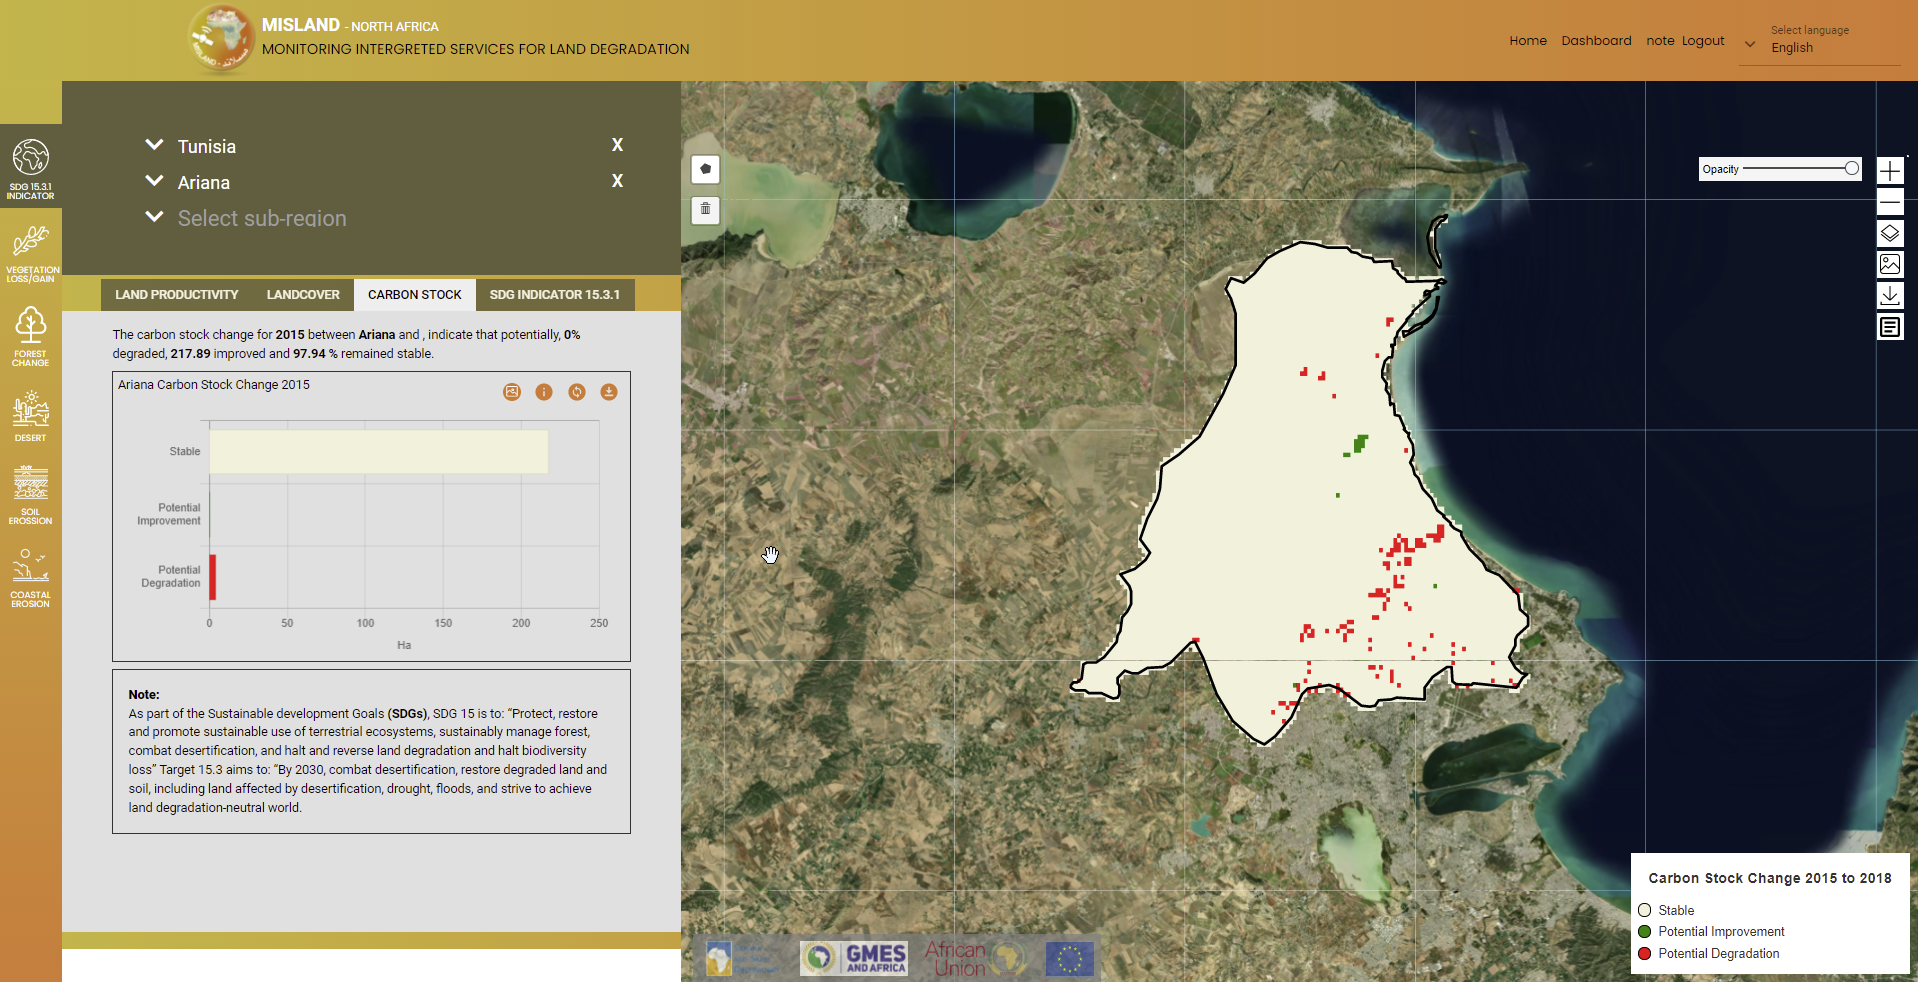
The map and computed statistics will be displayed on the map panel and summary pannel respectively.
 option which appears as the first item in the menu to compute SDG 15.3.1 indicator and its sub-indicators forllowing the steps described below:
 option. This should pop-up a selection panel as in the diagram below:
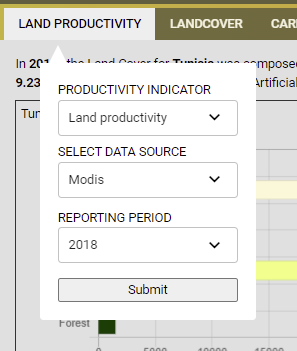
 options.
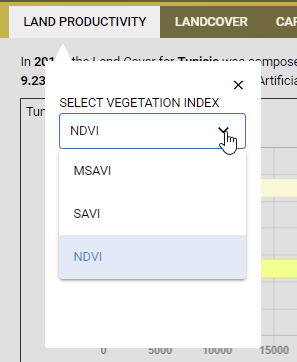
 button at the pottom of the selection pop-up window to compute the selected indicator. The map and statistics should be dispalyed as shown below.
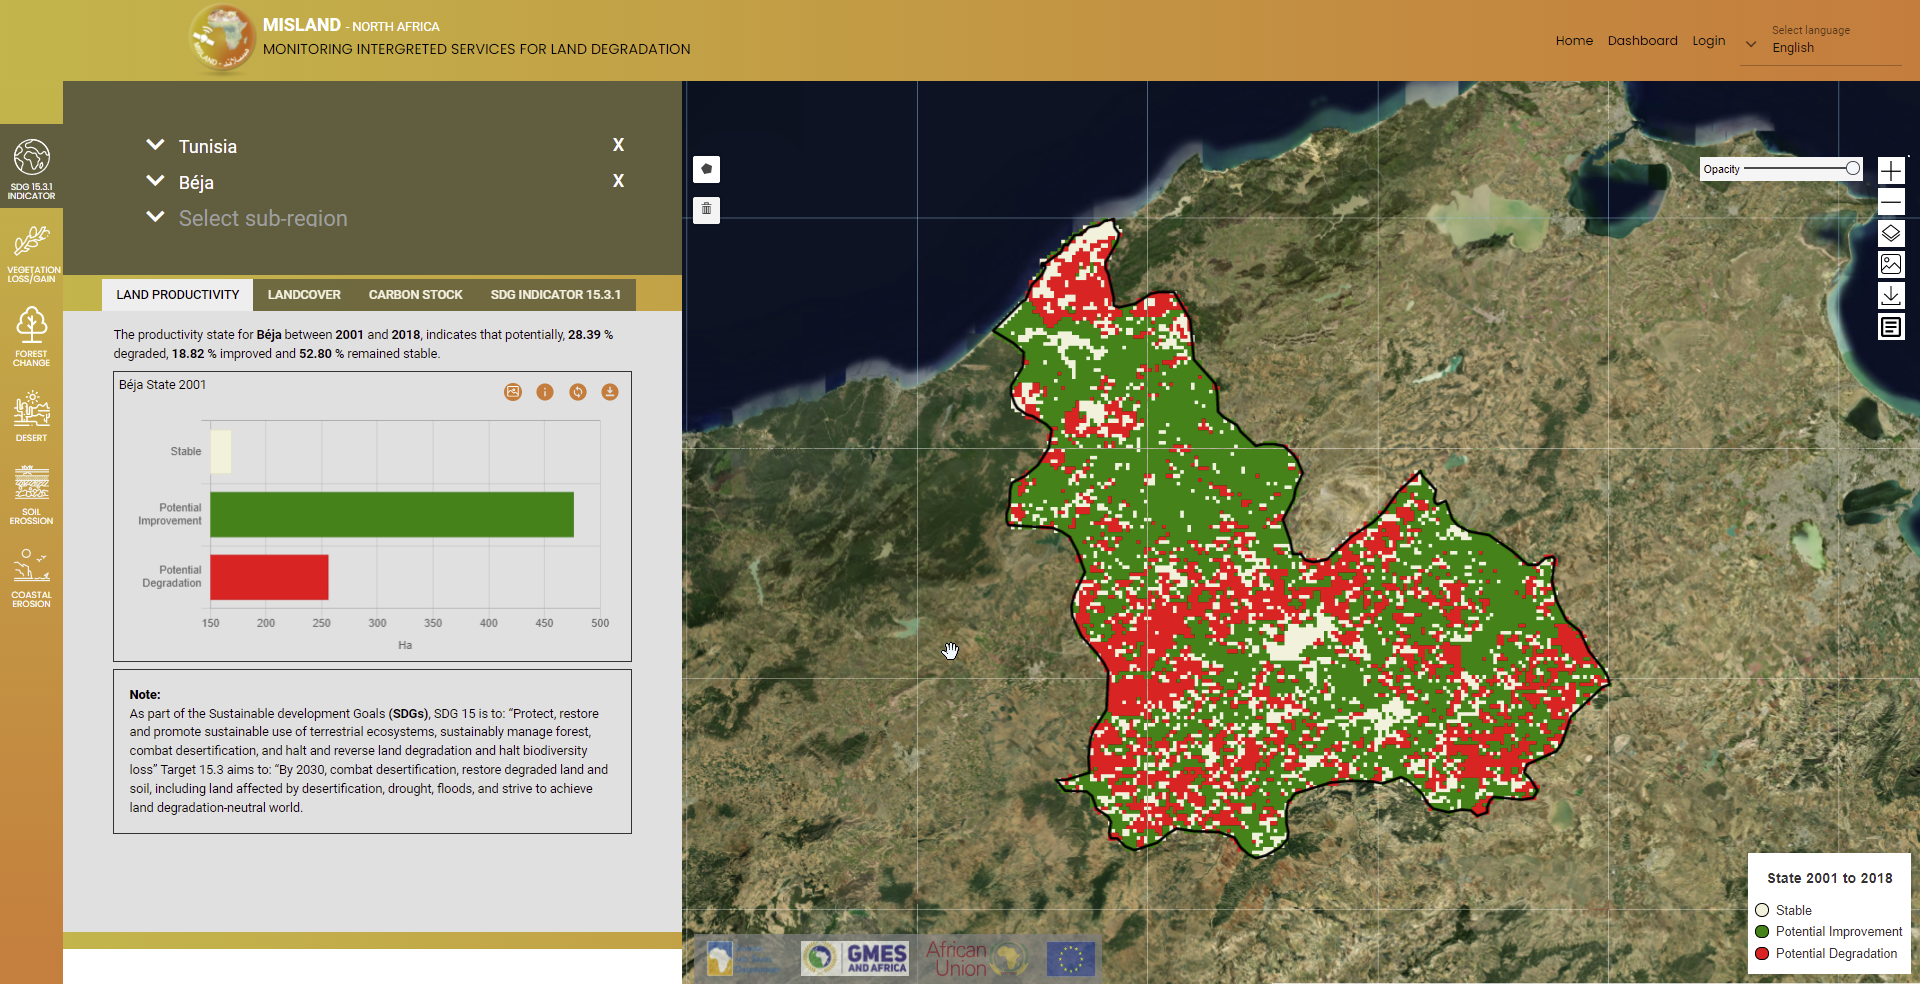
 option under the SDG indicator menu as described in the steps below
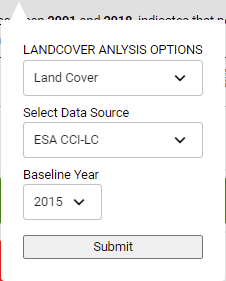
 option and under the SDG indicator menu-bar. This should pop-up a dialog as the one shown below
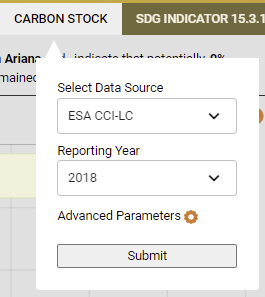
 option. This should show a pop-up as the one shown below